Brighton TAS 7030
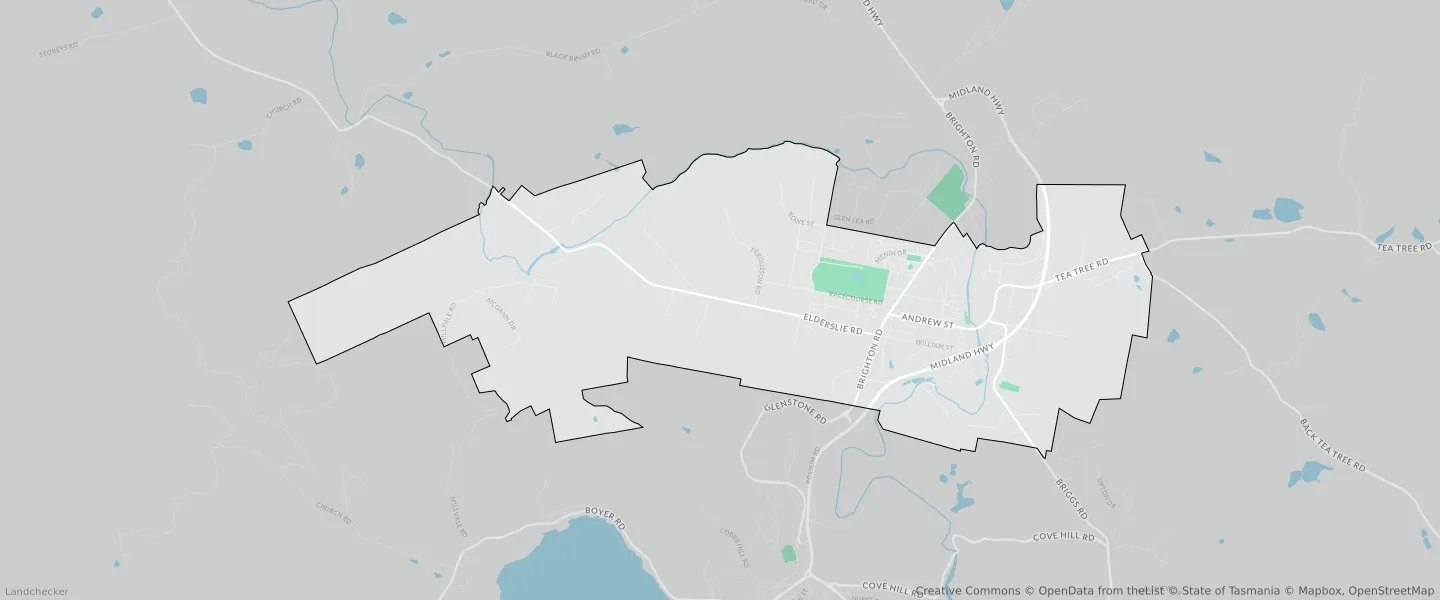
This Brighton suburb profile includes demographic data and planning information to help you make an informed property decision.
An average home in Brighton is owned with a mortgage by couples with children. The average age in Brighton is 34. Separate houses are common in Brighton and the area is mostly AGRICULTURE (28.54%), RURAL LIVING (17.88%) and AGRICULTURE (15.39%).
Brighton demographics
Population
4983
Average Age
34
Age Distribution
Employment Type
Median Weekly Income
Traveled to Work
Car
87.9%
Tram
0.0%
Bicycle
0.0%
Train
0.0%
Walking
1.4%
Bus
1.2%
Brighton property information
Number of Bedrooms
Tenure Type
Property Types in Brighton
Separate house
Semi detached house
Unit/Apartment
Median monthly mortgage repayments
$1,450
Median weekly rental payments
$350
Average number of bedrooms per dwelling
3.0
Average number of people per household
3
Household Composition
Family Composition
Couple family without children
One parent family
Couple family with children
BRIGHTON planning zones
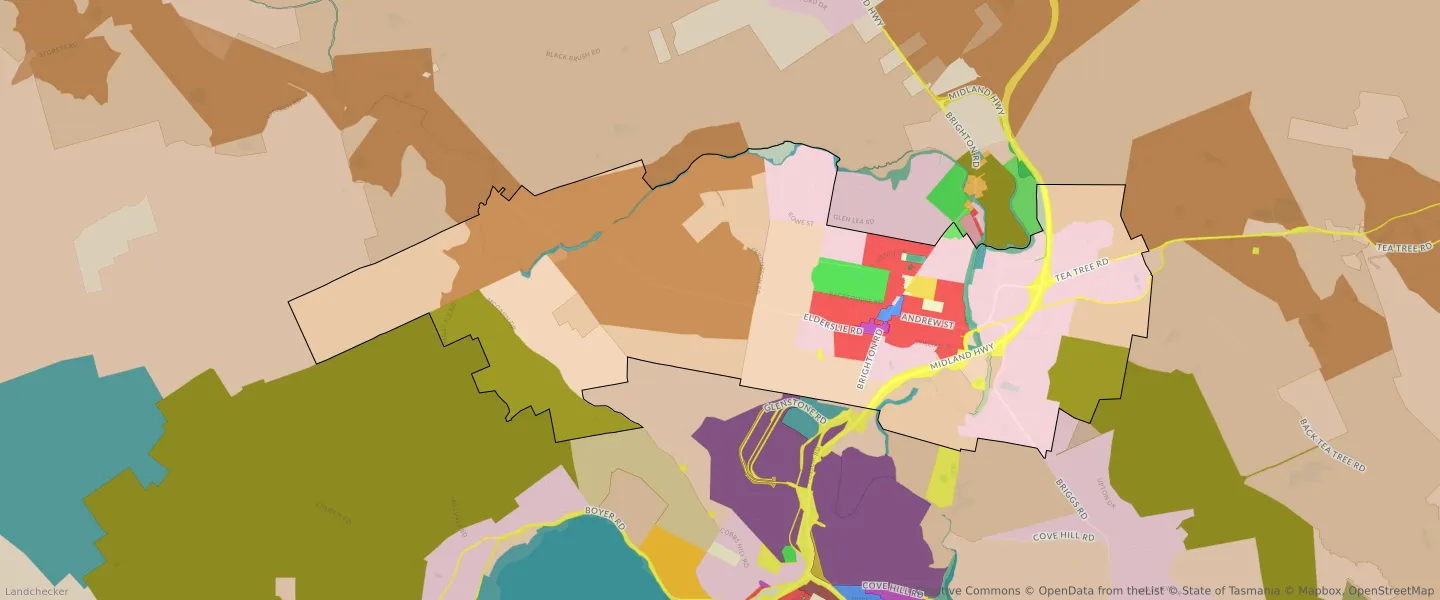
| Zone Code | Zone Name | Percentage Covered | Area Covered | |
|---|---|---|---|---|
| AGRICULTURE | AGRICULTURE | 28.54% | 8,850,161.42㎡ | |
| AGRICULTURE | AGRICULTURE | 15.39% | 4,773,322.37㎡ | |
| COMMUNITY PURPOSE | COMMUNITY PURPOSE | 0.6% | 186,592.08㎡ | |
| ENVIRONMENTAL MANAGEMENT | ENVIRONMENTAL MANAGEMENT | 0% | 1,258.02㎡ | |
| ENVIRONMENTAL MANAGEMENT | ENVIRONMENTAL MANAGEMENT | 1.3% | 402,464.98㎡ | |
| GENERAL BUSINESS | GENERAL BUSINESS | 0.2% | 63,121.54㎡ | |
| GENERAL RESIDENTIAL | GENERAL RESIDENTIAL | 7.08% | 2,195,313.92㎡ | |
| LANDSCAPE CONSERVATION | LANDSCAPE CONSERVATION | 9.62% | 2,982,156.92㎡ | |
| LIGHT INDUSTRIAL | LIGHT INDUSTRIAL | 0.5% | 153,672.58㎡ | |
| LOCAL BUSINESS | LOCAL BUSINESS | 0.02% | 6,602.34㎡ | |
| OPEN SPACE | OPEN SPACE | 0.84% | 260,282.51㎡ | |
| PARTICULAR PURPOSE | PARTICULAR PURPOSE | 0.36% | 110,090.68㎡ | |
| RECREATION | RECREATION | 1.75% | 542,235.88㎡ | |
| RURAL | RURAL | 13.43% | 4,164,156.75㎡ | |
| RURAL LIVING | RURAL LIVING | 17.88% | 5,545,188.89㎡ | |
| URBAN MIXED USE | URBAN MIXED USE | 0.02% | 6,731.79㎡ | |
| UTILITIES | UTILITIES | 2.46% | 763,684.74㎡ |
Looking to research a property in BRIGHTON?
Go to mapData Source - ABS