Jindera NSW 2642
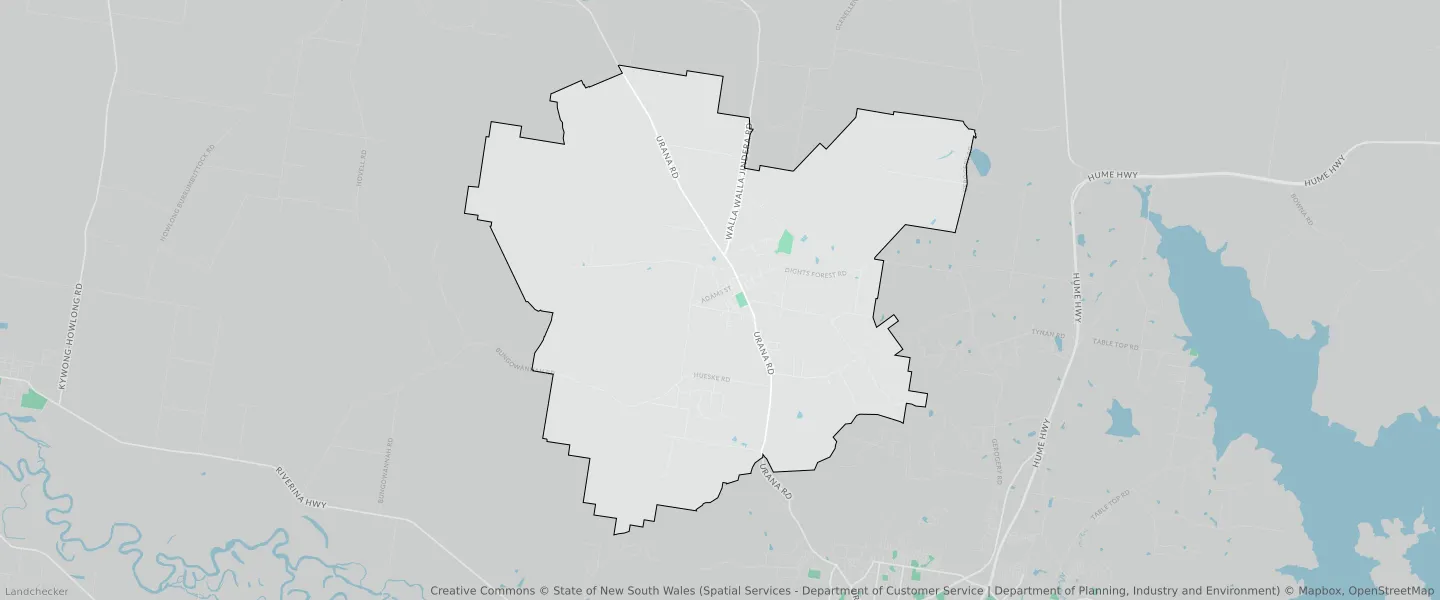
This Jindera suburb profile includes demographic data and planning information to help you make an informed property decision.
An average home in Jindera is owned with a mortgage by couples with children. The average age in Jindera is 38. Separate houses are common in Jindera and the area is mostly Primary Production (63.79%), Primary Production (63.66%) and Primary Production Small Lots (29.87%).
Jindera demographics
Population
2721
Average Age
38
Age Distribution
Employment Type
Median Weekly Income
Traveled to Work
Car
91.0%
Tram
0.0%
Bicycle
0.0%
Train
0.0%
Walking
1.8%
Bus
0.5%
Jindera property information
Number of Bedrooms
Tenure Type
Property Types in Jindera
Separate house
Semi detached house
Unit/Apartment
Median monthly mortgage repayments
$1,573
Median weekly rental payments
$316
Average number of bedrooms per dwelling
3.6
Average number of people per household
3
Household Composition
Family Composition
Couple family without children
One parent family
Couple family with children
JINDERA planning zones
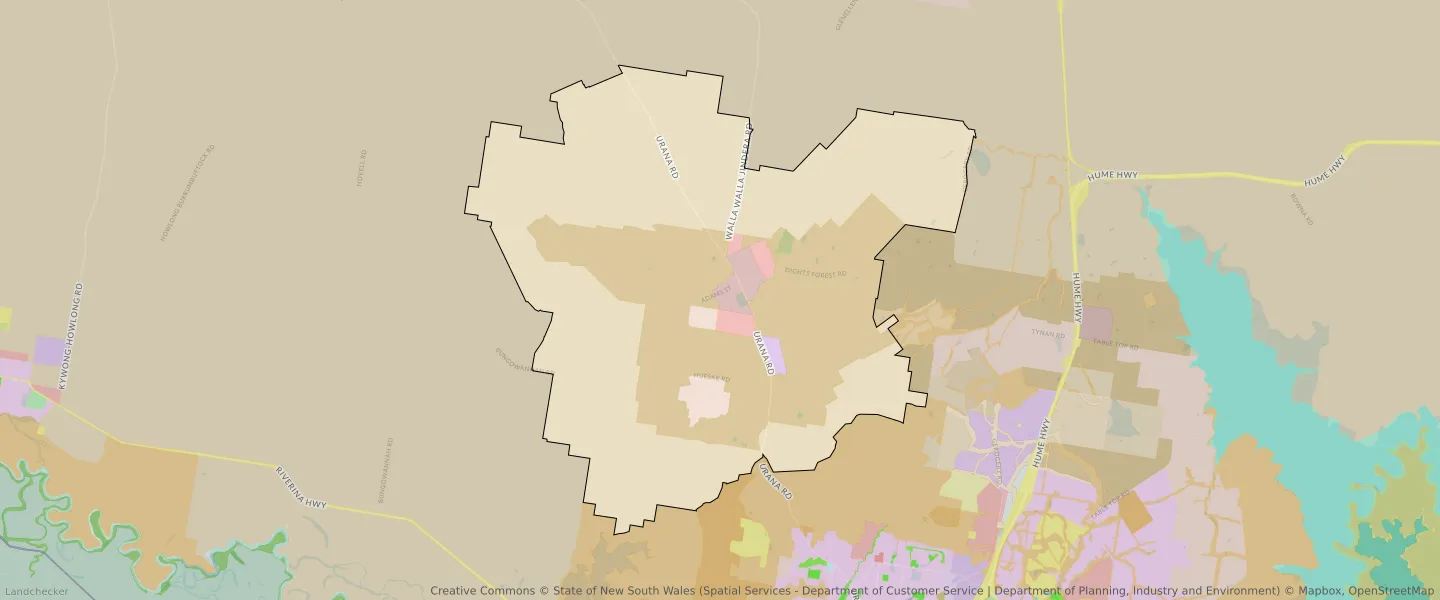
| Zone Code | Zone Name | Percentage Covered | Area Covered | |
|---|---|---|---|---|
| C2 | Environmental Conservation | 0.05% | 63,594.95㎡ | |
| C3 | Environmental Conservation | 0.01% | 11,862.51㎡ | |
| E4 | General Industrial | 0.45% | 617,226.35㎡ | |
| R2 | Environmental Living | 1.46% | 2,014,648.59㎡ | |
| R5 | Large Lot Residential | 1.32% | 1,823,311.67㎡ | |
| R5 | Large Lot Residential | 2.95% | 4,085,491.77㎡ | |
| RU1 | Primary Production | 63.66% | 88,123,459.85㎡ | |
| RU1 | Primary Production | 63.79% | 88,292,812.78㎡ | |
| RU4 | Primary Production Small Lots | 29.87% | 41,335,012.19㎡ | |
| RU5 | Village | 1.42% | 1,959,630.2㎡ | |
| SP2 | Infrastructure | 0% | 3,117.54㎡ |
Looking to research a property in JINDERA?
Go to mapData Source - ABS