Mangoplah NSW 2652
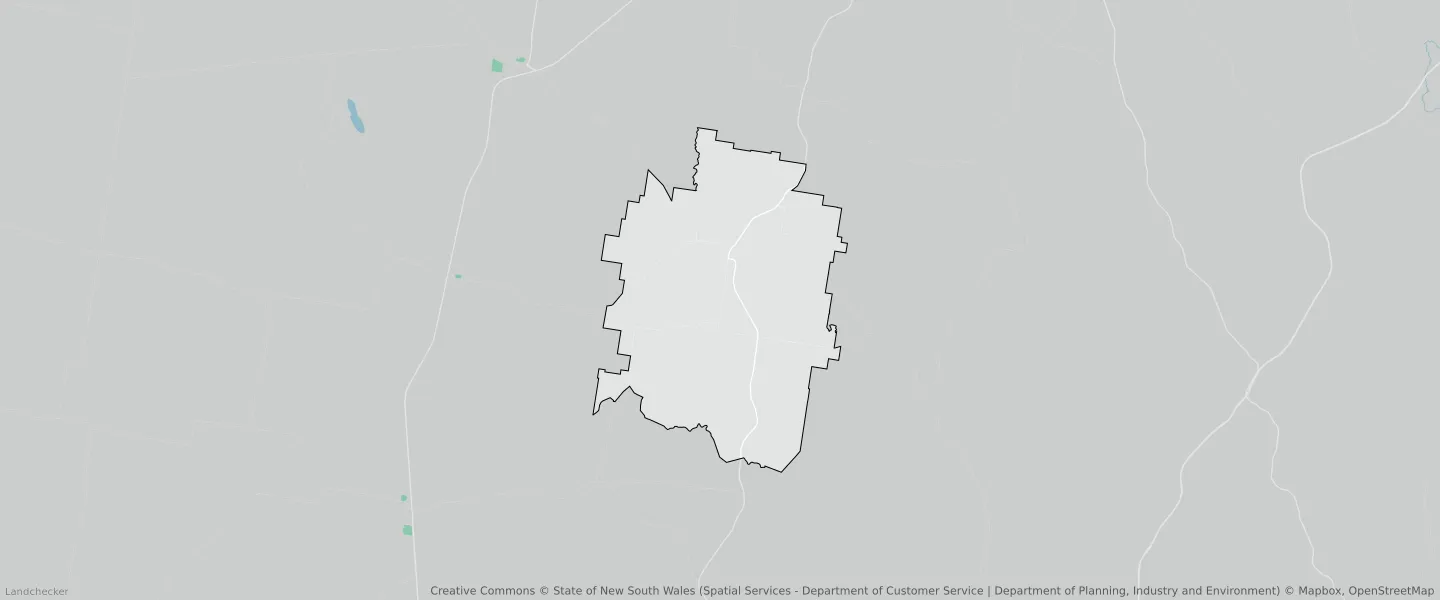
This Mangoplah suburb profile includes demographic data and planning information to help you make an informed property decision.
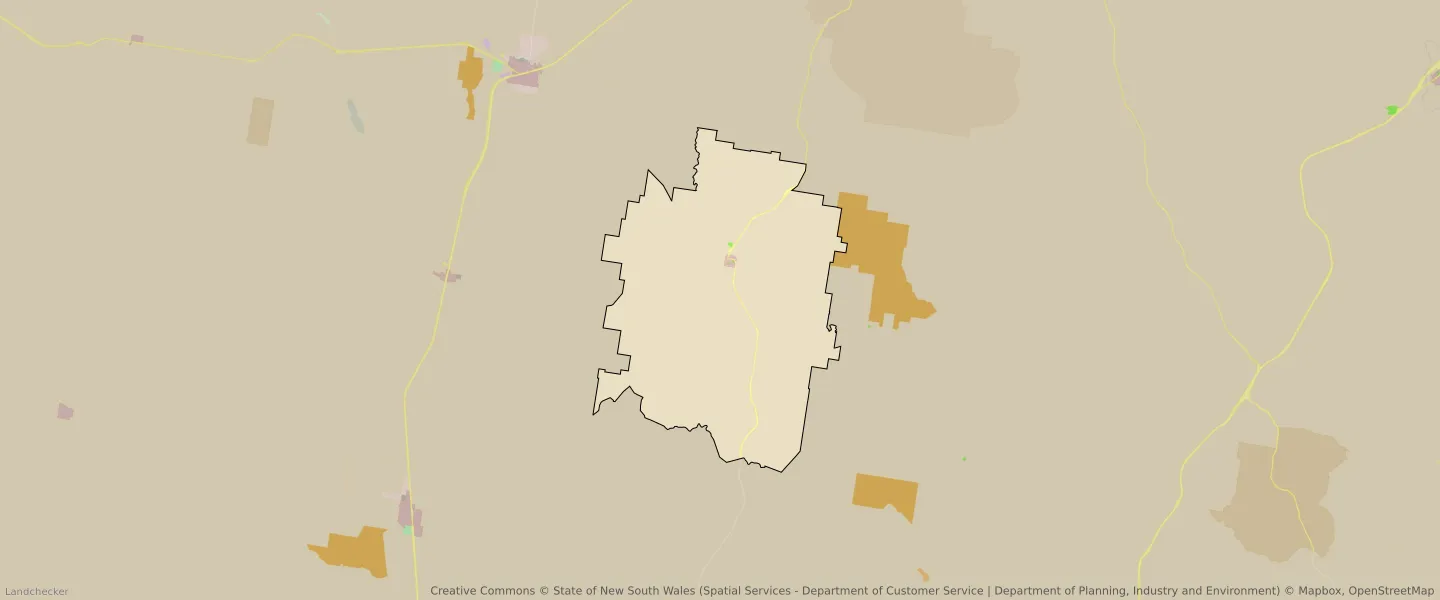
An average home in Mangoplah is owned outright by couples with children. The average age in Mangoplah is 47. Separate houses are common in Mangoplah and the area is mostly Primary Production (99.27%), Primary Production (64.16%) and Infrastructure (0.49%).
Mangoplah demographics
Population
291
Average Age
47
Age Distribution
Employment Type
Median Weekly Income
Traveled to Work
Car
77.4%
Tram
0.0%
Bicycle
0.0%
Train
0.0%
Walking
12.3%
Bus
0.0%
Mangoplah property information
Number of Bedrooms
Tenure Type
Property Types in Mangoplah
Separate house
Semi detached house
Unit/Apartment
Median monthly mortgage repayments
$1,213
Median weekly rental payments
$200
Average number of bedrooms per dwelling
3.8
Average number of people per household
3
Household Composition
Family Composition
Couple family without children
One parent family
Couple family with children
MANGOPLAH planning zones
| Zone Code | Zone Name | Percentage Covered | Area Covered | |
|---|---|---|---|---|
| RE1 | Low Density Residential | 0.04% | 88,462.19㎡ | |
| RU1 | Primary Production | 99.27% | 218,569,890.63㎡ | |
| RU1 | Primary Production | 64.16% | 141,265,245.26㎡ | |
| RU5 | Village | 0.19% | 425,703.27㎡ | |
| SP2 | Infrastructure | 0.49% | 1,070,068.31㎡ | |
| SP2 | Infrastructure | 0.49% | 1,073,530.11㎡ |
Looking to research a property in MANGOPLAH?
Go to mapData Source - ABS