Whyalla SA 5600
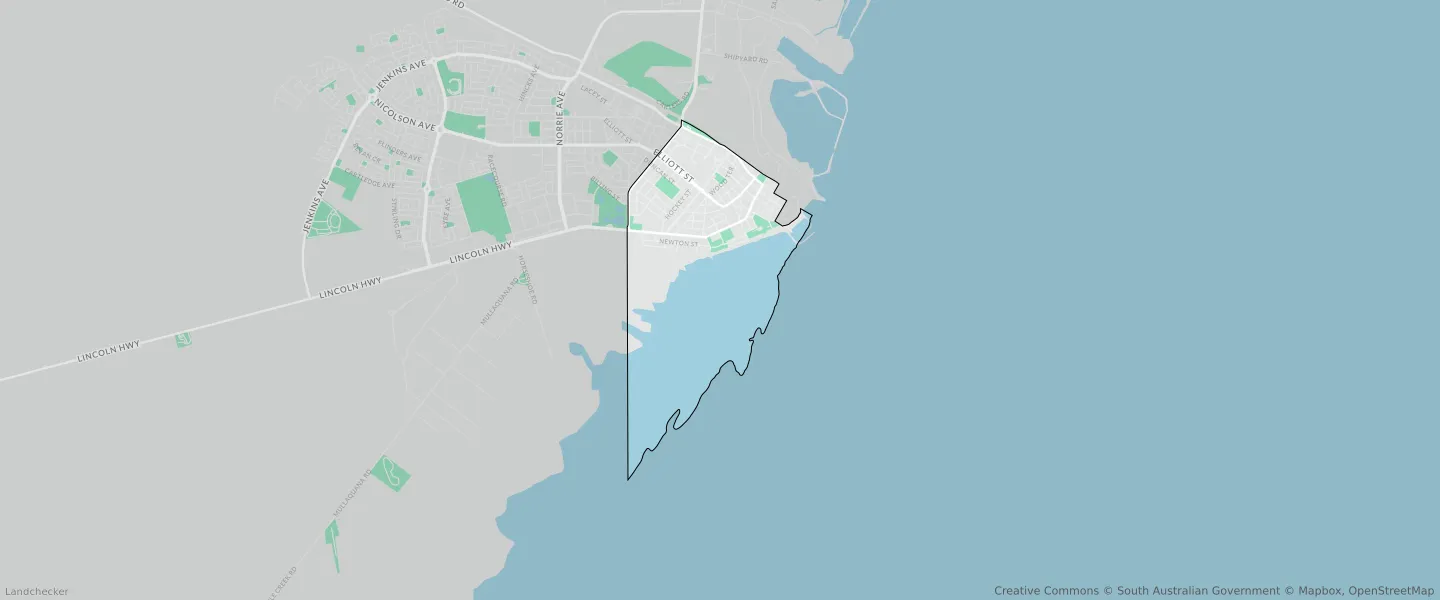
This Whyalla suburb profile includes demographic data and planning information to help you make an informed property decision.
An average home in Whyalla is owned with a mortgage by couples without children. The average age in Whyalla is 46. Separate houses are common in Whyalla and the area is mostly COASTAL WATERS AND OFFSHORE ISLANDS (52.27%), GENERAL NEIGHBOURHOOD (16.92%) and OPEN SPACE (11.19%).
Whyalla demographics
Population
3609
Average Age
46
Age Distribution
Employment Type
Median Weekly Income
Traveled to Work
Car
82.6%
Tram
0.0%
Bicycle
1.6%
Train
0.0%
Walking
5.6%
Bus
1.9%
Whyalla property information
Number of Bedrooms
Tenure Type
Property Types in Whyalla
Separate house
Semi detached house
Unit/Apartment
Median monthly mortgage repayments
$1,300
Median weekly rental payments
$200
Average number of bedrooms per dwelling
2.9
Average number of people per household
2
Household Composition
Family Composition
Couple family without children
One parent family
Couple family with children
WHYALLA planning zones
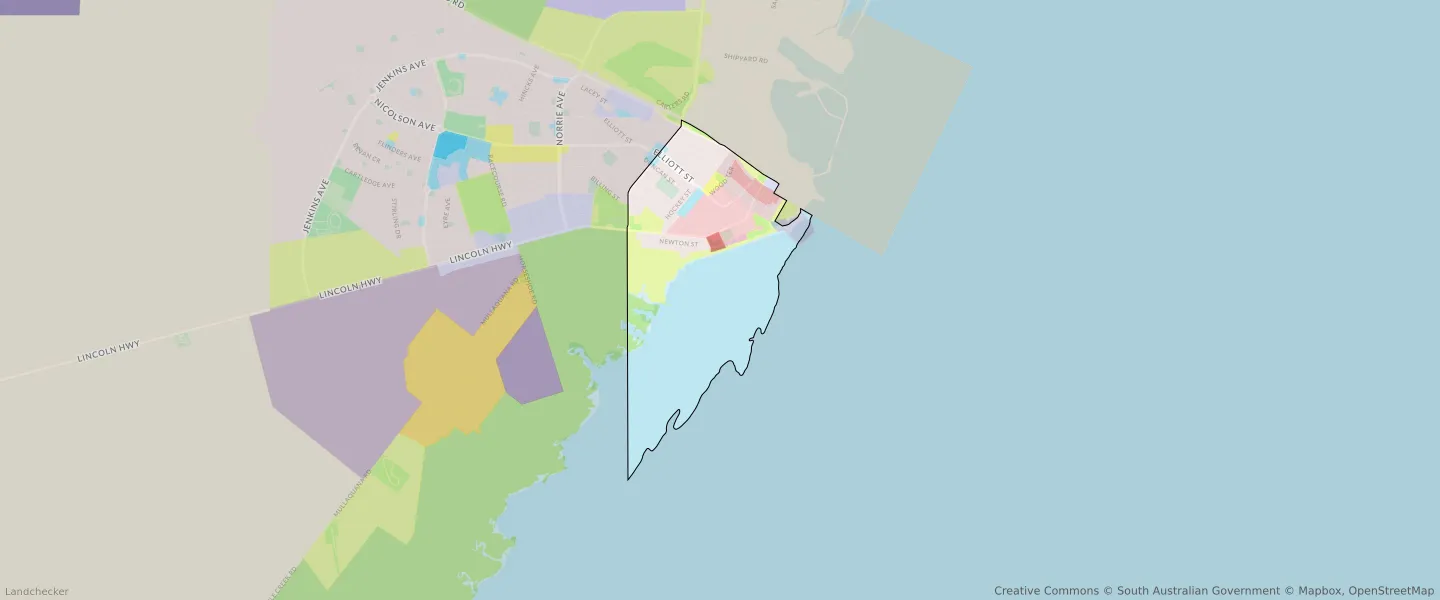
| Zone Code | Zone Name | Percentage Covered | Area Covered | |
|---|---|---|---|---|
| CF | COMMUNITY FACILITIES | 0.77% | 73,467.73㎡ | |
| CON | CONSERVATION | 2.22% | 213,096.65㎡ | |
| CTP | CARAVAN AND TOURIST PARK | 0.63% | 60,546.59㎡ | |
| CWOI | COASTAL WATERS AND OFFSHORE ISLANDS | 52.27% | 5,009,975.76㎡ | |
| E | EMPLOYMENT | 0.36% | 34,344.37㎡ | |
| EN | ESTABLISHED NEIGHBOURHOOD | 3.45% | 330,375.6㎡ | |
| GN | GENERAL NEIGHBOURHOOD | 16.92% | 1,621,988.01㎡ | |
| INF-FMF | INFRASTRUCTURE (FERRY AND MARINA FACILITIES) | 1.42% | 136,445.03㎡ | |
| LAC | LOCAL ACTIVITY CENTRE | 1.03% | 99,198.11㎡ | |
| OS | OPEN SPACE | 11.19% | 1,072,649.58㎡ | |
| RA | REMOTE AREAS | 0% | 243.04㎡ | |
| SN | SUBURBAN NEIGHBOURHOOD | 7.54% | 722,510.38㎡ | |
| TMS | TOWNSHIP MAIN STREET | 1.96% | 187,571.21㎡ | |
| URN | URBAN RENEWAL NEIGHBOURHOOD | 0.25% | 23,548.31㎡ |
Looking to research a property in WHYALLA?
Go to mapData Source - ABS